绘图:.plot()
plt.plot():绘制点和线[1]
1 | from numpy.random import randn |
- randn函数返回一个或一组样本,具有标准正态分布;
- cumsum函数计算各行的累加值[2];
- in:
1 | import numpy as np |
out:
1 | array([ 1, 3, 6, 10, 15, 21]) |
k-- 是线性选项,指定黑色虚线;
颜色(color),标记(marker),线型(linestyle)
指定绿色虚线:
1 | ax.plot(x,y,'g--') # 一样的效果,更简洁 |
指定黑色虚线,标记类型:
1 | plt.plot(randn(50).cumsum(),'ko--') |
用字符串指定时,颜色一定在最前面,可规范顺序:color+marker+line style
Color[3]:
| Long Name | Short Name | RGB Triplet |
|---|---|---|
| blue | b | [0,0,1] |
| black | k | [0,0,0] |
| red | r | [1,0,0] |
| green | g | [0,1,0] |
| yellow | y | [1,1,0] |
| cyan | c | [0,1,1] |
| magenta | m | [1,0,1] |
| white | w | [1,1,1] |
Marker[4]:
| Marker | Description | Resulting Marker |
|---|---|---|
| "o" | Circle |  |
| "+" | Plus sign |  |
| "*" | Asterisk |  |
| "." | Point |  |
| "x" | Cross |  |
| "_" | Horizontal line |  |
| " | " | Vertical line |  |
| "square" | Square |  |
| "diamond" | Diamond |  |
| "^" | Upward-pointing triangle |  |
| "v" | Downward-pointing triangle |  |
| ">" | Right-pointing triangle |  |
| "<" | Left-pointing triangle |  |
| "pentagram" | Pentagram |  |
| "hexagram" | Hexagram |  |
Line Style[4]:
| Line Style | Description | Resulting Line |
|---|---|---|
| "-" | Solid line |  |
| "- -" | Dashed line |  |
| ":" | Dotted line |  |
| "-." | Dash-dotted line |  |
Draw Style:在线型图中,可按非线性插值;
1 | plt.plot(randn(50),'ko--',drawstyle='steps-post',label='steps-post') |
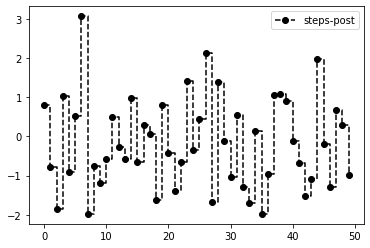
目前有三种可选:steps、steps-mid、steps-post 具体差别还待探究;
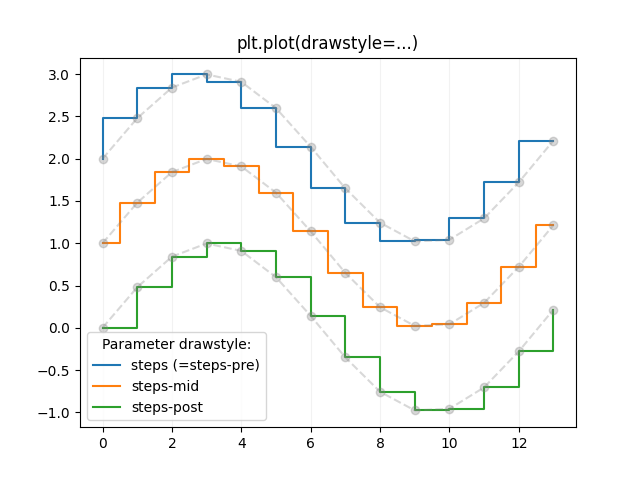 该图出处:https://matplotlib.org/stable/gallery/lines_bars_and_markers/step_demo.html